2024 Winkler Vital Signs Report
The Winkler Community Foundation’s 2024 Vital Signs initiative is a community check-up that measures the vitality of the community, identifies opportunities, and supports action on issues that are critical to well-being.
Using this evidence-based approach, the Winkler Community Foundation connects the community to its greatest opportunities. The report helps inform governance, guide targeted grant-making and foster collaborative partnerships. The goal is to empower decision-makers, policymakers and residents alike to take action, aiming to improve the quality of life for all in the region.
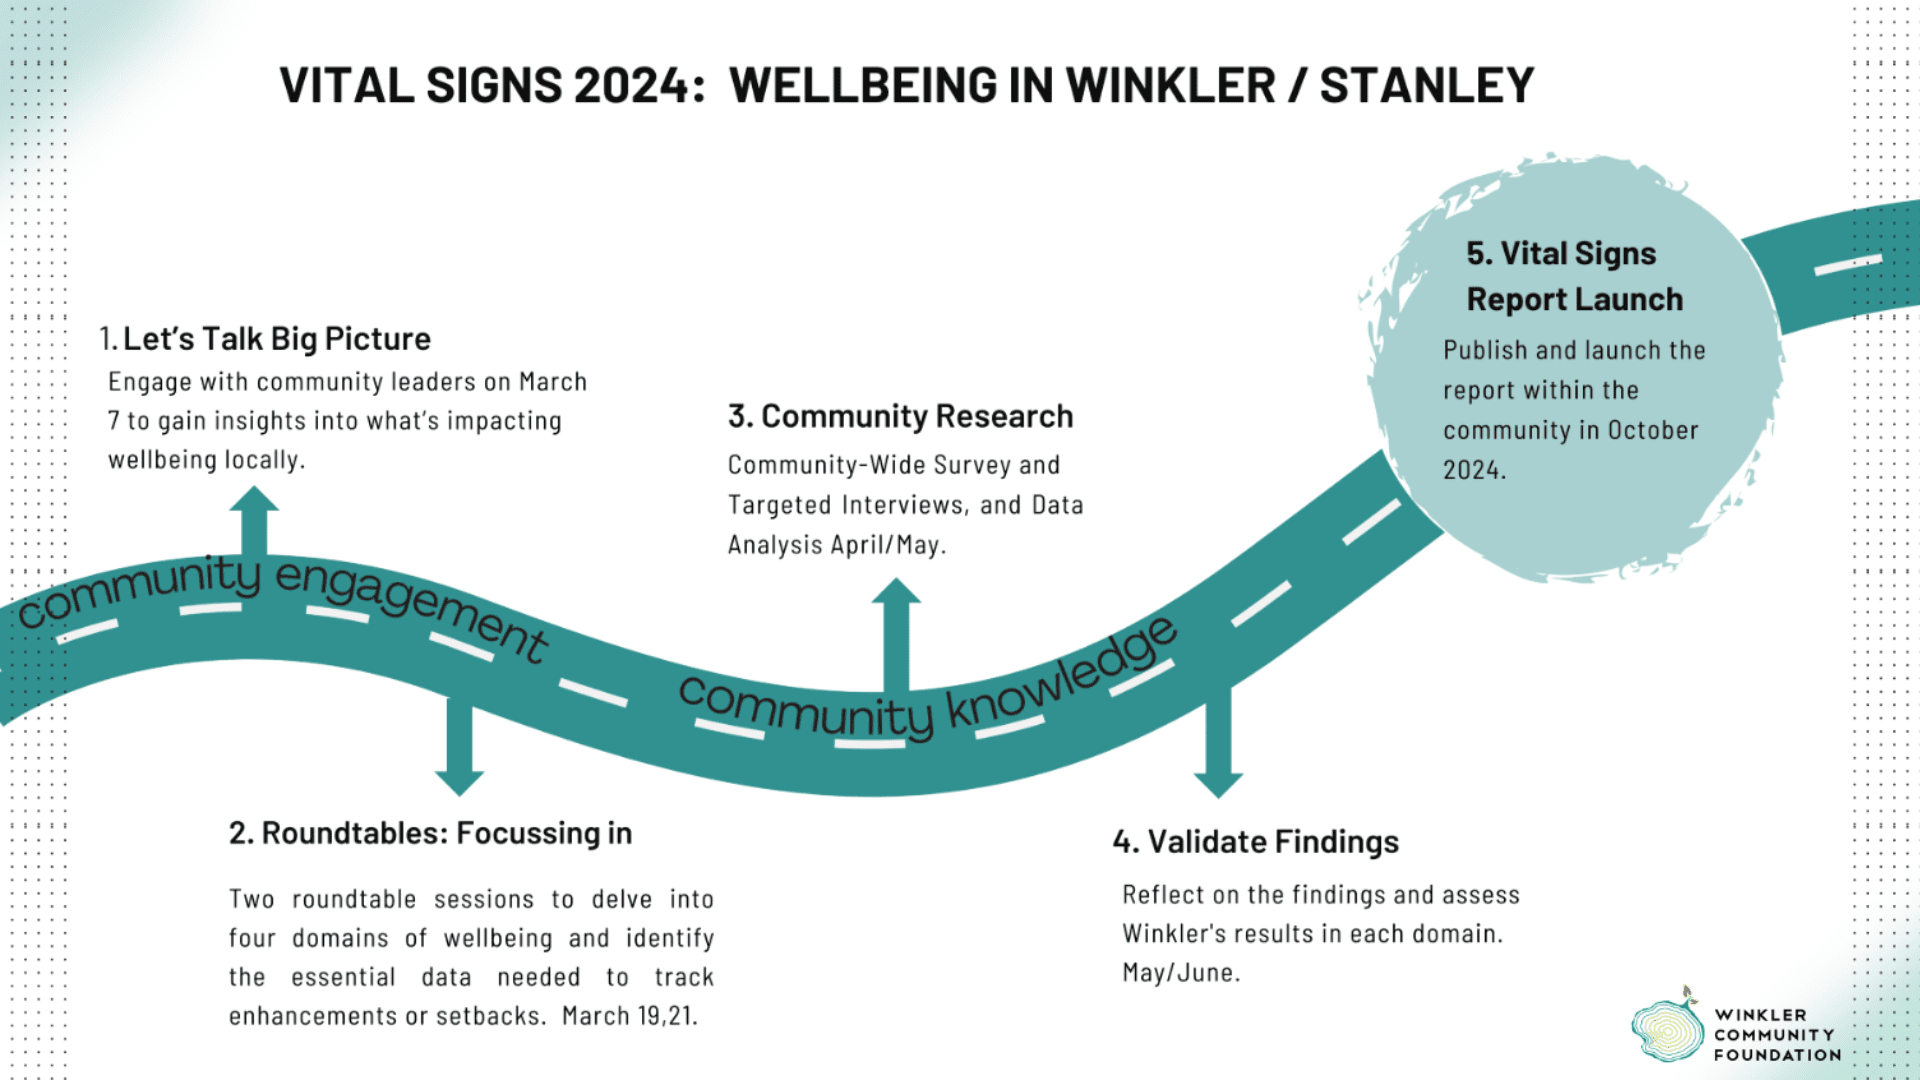
2024 Vital Signs Project
Winkler’s Vital Signs is a community check-up that measures the vitality of our community and identifies significant trends in a range of areas critical to the quality of life. Winkler’s Vital Signs grows our understanding of resident priorities and identifies areas of need within the community. We work with an advisory committee to build community input on our reporting, guide our work with local stakeholders, and mobilize action on the findings.
What Makes Up Wellbeing?
If you measure indicators of wellbeing (VITAL SIGNS) and understand how they are interconnected, you can use that evidence to make decisions that support and improve wellbeing across your entire community.
These domains or areas are all related, and many times, if you improve something in one area, it will improve other areas as well.
Understanding each area is a necessary part of understanding your community’s overall wellbeing.

Wellbeing Domains and Indicators
Health & Wellness:
This domain assesses the community’s overall health by examining the status and needs of the population, including the accessibility of healthcare services. It looks at how well the community supports its members’ health through timely and accessible care.
Indicator examples: General health statistics; accessibility to healthcare providers; wait times for services; the availability of mental health and addictions support; home care and personal care home availability; local vacancy rates.
Education & Learning:
Assesses the educational landscape of the community, from early childhood learning to adult educational programs, focusing on the accessibility, affordability, and quality of learning experiences that cater to lifelong educational journeys.
Indicator examples: Graduation rates; classroom sizes; affordability of higher education locally and away, museum & heritage resources; continuing adult education opportunities; access to educational supports
Arts & Recreation:
This domain explores the richness of community life through engagement in arts and sports. It includes not just the shows and artistic displays that colour the local cultural scene but also the clubs, ensembles, and recreational facilities that provide diverse opportunities for play and leisure.
Indicator examples: Number and diversity of art classes or clubs; local library programs; sports/athletics participation; usage rates of facilities such as rinks and pools
Environment:
Concerns the stewardship and condition of the natural environment, management of community spaces, and readiness to handle environmental challenges with a focus on sustainable practices and responsible resource management.
Indicator examples: Measurements of air and water quality; availability of public green spaces; community response planning to environmental emergencies; local recycling programs.
Standard of Living:
This domain reflects on the economic foundations that support quality of life, including the affordability of essentials, the support for caregiving, and the balance of work and leisure that together form the fabric of daily life in the community.
Indicator examples: Monthly shelter costs; Cost of living index / poverty market basket; housing tenure type; vacancy rates; food security, working hours; income distribution and household family types.
Community Resilience:
Encompasses the community’s ability to withstand challenges and prosper, with a focus on access to services, a robust local economy, public safety, and infrastructure—including transportation systems—that connect and strengthen the community.
Indicator examples: Local businesses by employees and sector; Employment rate; Local consumer spending; Crime severity index; Available childcare spaces; Mode of transport to work; Commute times; Internet access.
Civic & Democratic Engagement:
Reflecting the health of the community’s civic life, this domain captures how residents engage in democratic processes, contribute to charitable causes, and participate in their community as volunteers, ultimately shaping the community’s future.
Indicator examples: Charitable giving statistics; volunteerism; civic meeting attendance, election turnout rates; local representation
Culture & Belonging:
Highlights the importance of creating a community where every individual feels the opportunity to be connected and represented, whether through community events, cultural or faith-based participation, or inclusive public spaces that foster social belonging.
Indicator examples: Self-assessed feeling of belonging; Attendance at community and cultural events; diversity of participation in faith-based activities; representation in leadership or public professions; availability and usage of inclusive public spaces.


